Abstract
“You are what you eat.” This age-old proverbial saying contains the notion that what we eat plays a role in our health, including our happiness [1]. Using data from the World Happiness Report and consumable data from Our World in Data, I studied whether this adage had any data science-backed truth to it. I looked individually at how numerous consumables seemed to be correlated with happiness in countries from around the world. I discovered that Meat had the highest Pearson Correlation (almost 0.75) and I was able to model this using a linear regression. When considering fruits, I found that countries which consumed more Oranges and Mandarins seemed to be happier than countries that ate other fruits. Likewise, in terms of alcohol, countries that consumed more wine and especially beer tended to be happier than countries that drank more spirits.
Materials and Methods
For the happiness data, I got it from the World Happiness Report [2] as it is largely considered to be the best metric for happiness data from around the world. For the consumables data, I used several datasets from Our World in Data [3]:
- Chocolate consumption (kilograms per capita per year) [4]
- Meat consumption (grams per capita per day) [5]
- Bovine consumption (kilograms per capita per year) [6]
- Fish and seafood consumption (kilograms per capita per year) [7]
- Different food groups consumption (grams per capita per day) [8]
- Fruit consumption (kilograms per capita per year) [9]
- Different fruits consumption (kilograms per capita per year) [10]
- Alcohol consumption (liters per capita (15+ years of age) per year) [11]
- Beer consumption (liters per capita (15+ years of age) per year) [12]
- Wine consumption (liters per capita (15+ years of age) per year) [13]
- Spirits consumption (liters per capita (15+ years of age) per year) [14]
- Egg consumption (kilograms per capita per year) [15]
- Milk consumption (kilograms per capita per year) [17]
- Cigarette consumption (number sold per capita (adult) per day) [18]
- Vegetable consumption (kilograms per capita per year) [19]
By using consumable data from one source, this meant that the metrics used to initially collect the data and the sampling techniques used for every consumable would be very similar. The column names, such as the country names, would also be similar and be easier to work with later.
Using two Python libraries, Pandas, for DataFrames, and xlrd [20], to read excel files, I first extracted all the data to their separate Pandas DataFrames from the downloaded excel files. I combined all the data from the different years of the Happiness Report into one big happiness DataFrame, with data from all countries around the world. Similarly, I had separate DataFrames for every type of consumable.
Next, for every consumable DataFrame I concatenated it with the happiness DataFrame to form a separate DataFrame which I dubbed a consumable-happiness DataFrame. From here, I calculated the Pearson Correlation between happiness and every consumable and added it to a Python dictionary. Using a Python library, matplotlib.pyplot, I was able to plot a bar chart for all the Pearson Correlations.
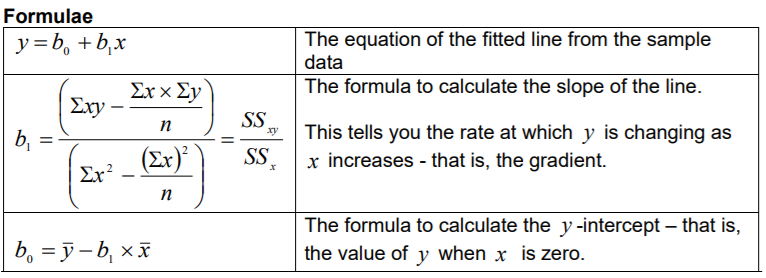
I wanted to find the linear regression between the consumable with the highest Pearson Correlation and the happiness rating. I tried two methods, one finding values manually and one able to do so automatically. For both methods, I created a new linear regression DataFrame.
For the manual method:
Using the equation y = a + b * x , where y was the happiness rating, a was the y-intercept, b was the gradient and x was the consumable data, I substituted values into these formulas:
[21]
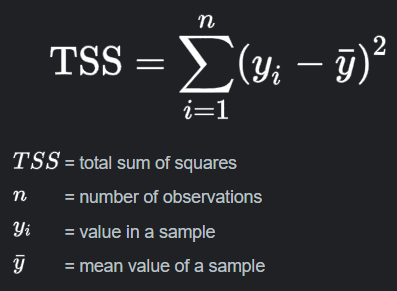
I was also able to calculate the coefficient of determination, R2, using the formula:
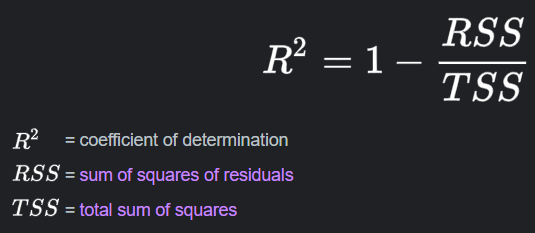
[22]
Through the following two formulas,
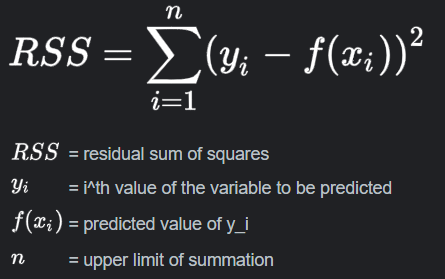
[22]
[22]
I was able to obtain a value for R2.
For the automatic method:
I used a Python library, SciPy [23], which was able to automatically produce the linear regression. The values for the gradient and the y-intercept were the same. This method was also able to confirm the Pearson Correlation value as well as provide the standard error of the linear regression.
Results
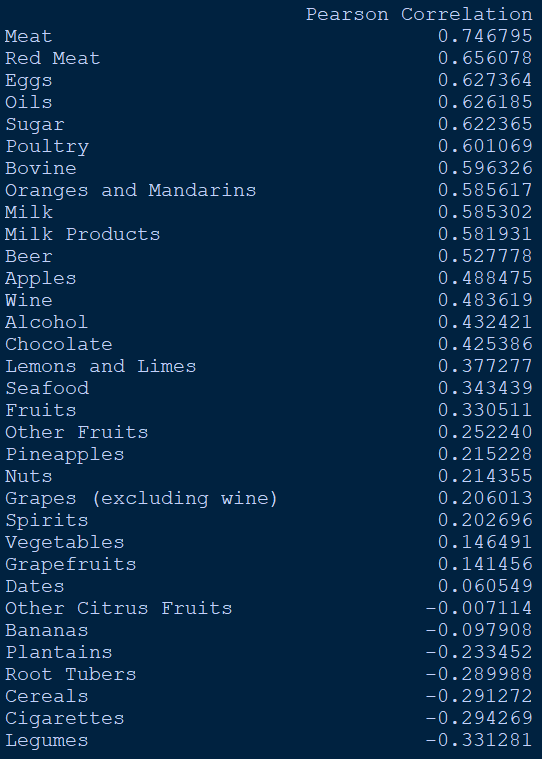
Tabulated results for the Pearson Correlations between different consumables and the happiness ratings for different countries:
Graphed results for the Pearson Correlations between different consumables and the happiness ratings for different countries:
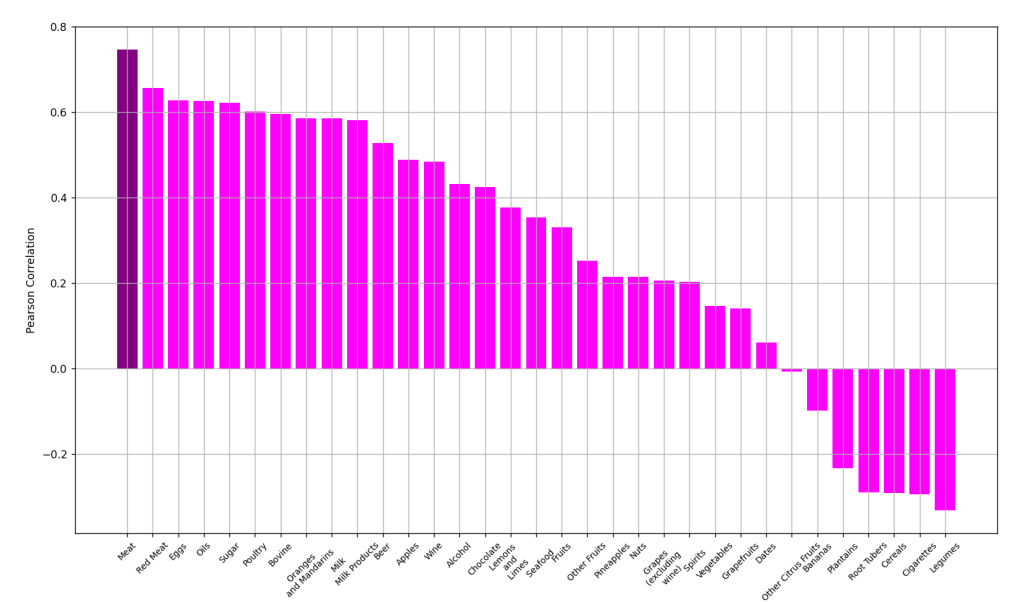
It’s interesting to note that although Fruits had quite a low Pearson Correlation of approximately 0.33, Oranges and Mandarins was almost twice as high at around 0.59.
Similarly, although Alcohol had a Pearson Correlation of only 0.43, both Beer (0.53) and Wine (0.48) surpassed it. Spirits only had 0.20.
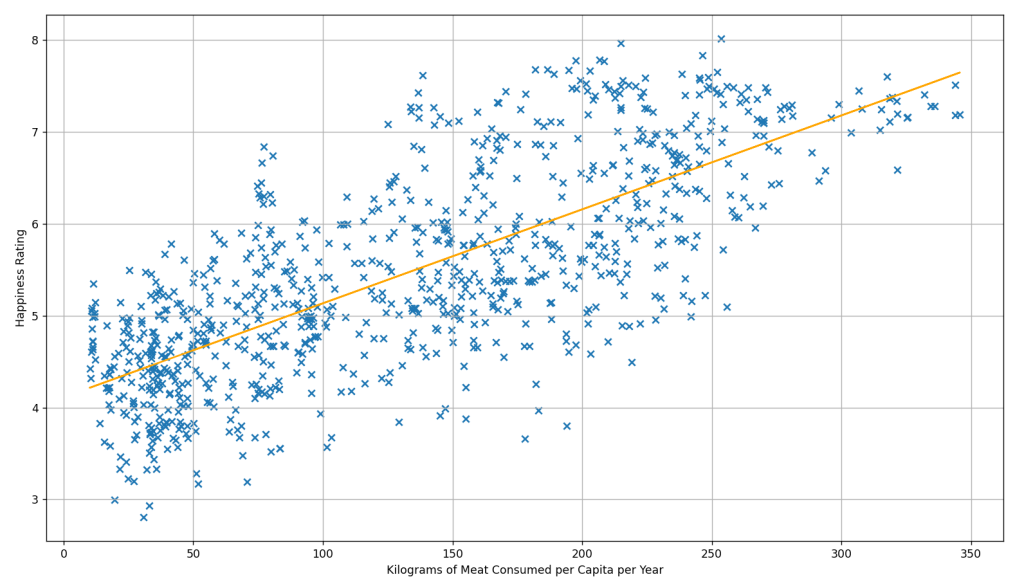
Linear regression between the highest Pearson Correlation, kilograms of meat consumed per capita per year, and the happiness ratings of countries around the world:
(to 5 significant figures):
y-intercept = 4.1128
gradient = 0.010226
standard error = 0.00030373
sum of residuals = 4.9027 × 10⁻¹³
R2 = 0.20693
Conclusion
Overall, no serious or definitive conclusions can be drawn from this investigation, due to the vastly different environmental, social, and political climates of the individual countries included in the study. With that said, there are some interesting results. Except for Seafood, it seems that the more animal products, especially meat, a country consumes, the happier it is. Surprisingly, electricity did not rank as highly as I assumed it would. The negative Pearson Correlation for Cigarettes was to be expected. It’s intriguing how those countries which drink more beer and wine seem to be happier than countries that consume more spirits, and likewise, countries that eat more oranges and mandarins seem to be happier than countries that consume other fruits.
References
[1] Kaur, Simerpreet, and Angela Van. “Do the Types of Food You Eat Influence Your Happiness?.” UC Merced Undergraduate Research Journal 9.2 (2017).
[2] Sustainable Development Solutions Network. World Happiness Report, https://worldhappiness.report/.
[3] Roser, Max. “Charts.” Our World in Data, https://ourworldindata.org/charts.
[4] “Chocolate Consumption per Person.” Our World in Data, https://ourworldindata.org/grapher/chocolate-consumption-per-person?country=USA~GBR~OWID_WRL~BRA~ZAF~BGD.
[5] “Daily Meat Consumption per Person.” Our World in Data, https://ourworldindata.org/grapher/daily-meat-consumption-per-person.
[6] “Beef and Buffalo Meat Consumption per Person.” Our World in Data, https://ourworldindata.org/grapher/beef-and-buffalo-meat-consumption-per-person.
[7] “Fish and Seafood Consumption per Capita.” Our World in Data, https://ourworldindata.org/grapher/fish-and-seafood-consumption-per-capita.
[8] “How Do Actual Diets Compare to the Eat-Lancet Diet?” Our World in Data, https://ourworldindata.org/grapher/eat-lancet-diet-comparison?tab=table&country=USA~GBR~EAT-Lancet~IND~KEN.
[9] “Fruit Consumption per Capita.” Our World in Data, https://ourworldindata.org/grapher/fruit-consumption-per-capita.
[10] “Fruit Consumption by Fruit Type.” Our World in Data, https://ourworldindata.org/grapher/fruit-consumption-by-fruit-type?country=~OWID_WRL.
[11] “Alcohol Consumption per Person.” Our World in Data, https://ourworldindata.org/grapher/total-alcohol-consumption-per-capita-litres-of-pure-alcohol.
[12] “Beer Consumption per Person.” Our World in Data, https://ourworldindata.org/grapher/beer-consumption-per-person.
[13] “Wine Consumption per Person.” Our World in Data, https://ourworldindata.org/grapher/wine-consumption-per-person.
[14] “Spirits Consumption per Person.” Our World in Data, https://ourworldindata.org/grapher/spirits-consumption-per-person.
[15] “Per Capita Egg Consumption.” Our World in Data, https://ourworldindata.org/grapher/per-capita-egg-consumption-kilograms-per-year.
[16] “Per Capita Electricity Consumption.” Our World in Data, https://ourworldindata.org/grapher/per-capita-electricity-consumption.
[17] “Per Capita Milk Consumption.” Our World in Data, https://ourworldindata.org/grapher/per-capita-milk-consumption.
[18] “Sales of Cigarettes per Adult per Day.” Our World in Data, https://ourworldindata.org/grapher/sales-of-cigarettes-per-adult-per-day.
[19] “Vegetable Consumption per Capita.” Our World in Data, https://ourworldindata.org/grapher/vegetable-consumption-per-capita.
[20] Machin, Stephen John. “XLRD.” Xlrd, 2019, https://xlrd.readthedocs.io/en/latest/.
[21] “Simple Linear Regression – Lincoln University.” Simple Linear Regression, Lincoln University, 2014, https://ltl.lincoln.ac.nz/wp-content/uploads/sites/20/2020/05/Simple-Linear-Regression.pdf.
[22] Enders, Felicity Boyd. “Coefficient of Determination.” Encyclopædia Britannica, Encyclopædia Britannica, Inc., 23 Dec. 2013, https://www.britannica.com/science/coefficient-of-determination.
[23] Virtanen, Pauli. “Scipy.” A Blue Circle with a Snake in the Shape of the Letter ‘S’., 4 Feb. 2022, https://scipy.org/.
Link to David’s codes on GitHub:
https://github.com/cybercon-com/Data-Analysis/blob/main/What_Food_Makes_Us_Happiest.py
If you have any questions, feel free to email: [email protected]
David is a recently graduated high school student located in Auckland, New Zealand. He is currently a development team member of Cybercon community. An earlier project he worked on was looking at the correlation between moon phases and market volatility. His paper can be found at:
https://www.megapro.com/how-do-moon-phases-affect-stock-prices