Abstract
This paper will look at how the full moon and the new moon quantitatively affect stock market prices and their tendency to fluctuate (volatility). Data analysis was carried out with Python. For a full moon, on average, prices started to increase from four days before the full moon and this carried on until the third day until the prices fell again. For a new moon, on average, the general trend is that prices seem to increase from more than ten days before the new moon and this continues until around eight days afterward.
Materials and Methods
This paper covers my thought process behind my results. The GitHub link to my code is here: https://git.io/J6m2I and I go in-depth into my Python code in this video: https://www.youtube.com/watch?v=wZVrb3XAdHY
I chose to study SPX and VIX as SPX is largely considered to be the benchmark index for the stock market [1] (Cremers et al., 2012). VIX is the benchmark indicator to measure the volatility, or how much prices will unpredictably fluctuate either up or down, of the market [2] (Zhang et al., 2006). I downloaded around one hundred years of data, which included date stamps and the corresponding indicator price, for both SPX and VIX.
To get all the dates for the full moon and new moon, I used a Python library called PyEphem. A library is code that other people have written. This library made it possible to output all the full and new moon dates within a set time period. I used the earliest and latest dates in the SPX and VIX data as my boundaries. I only kept the full and new moon dates which were in the SPX and VIX data and removed the rest.
For a set number of days surrounding the full moon or new moon date, I found the pricing information. If there was no data for a particular day, for example if the day was a weekend or if it was a holiday, I chose to ignore that day. I had attempted to consider a surrounding day as one which the stock market was open. However, there was the problem that there might be large gaps in the data, which means pricing data from different years could be accidentally used and therefore be inconsistent with the rest of the data. Defining a surrounding day without considering if the stock market is open or not on that day negates this problem.
I also ran across the problem of the indicator prices being vastly different in different years, and therefore were incomparable. For example, with SPX, in 1928 the price was around $17-$18, but in 2021 the price has risen to well over $4000. To solve this, I found a way of normalising data every year.
Let the price data for the surrounding days of a new moon or a full moon be called a “data set”. To normalise the data every year I calculated the percentage change from the price of the new moon or full moon day. This way, everything is in relation to the price of the indicator on the day of the moon phase change.
Finally, I averaged the percentage changes of the same day away from the moon phase day. For example, I averaged all the percentage changes of every third day before the full moon. I tabulated and graphed the results.
Results
For the full moon:
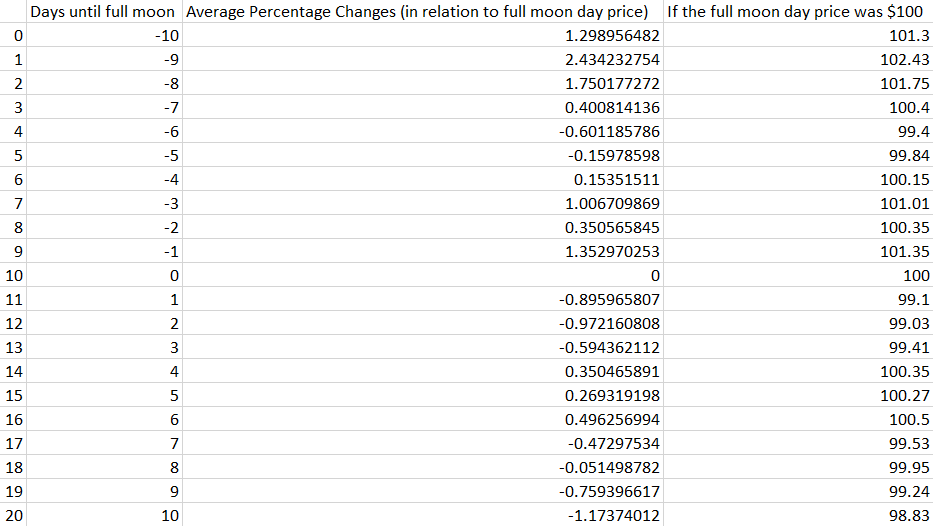
Tabulated results for SPX analysis:

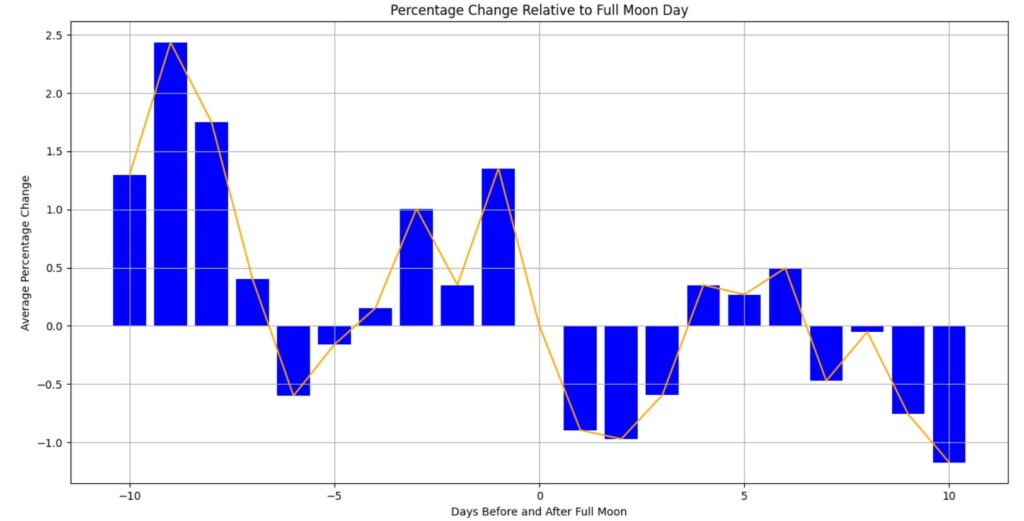
Graphed results for SPX analysis:
The price of SPX increases until a local maximum 6 days before the full moon and then drops rapidly but begins to rise again 4 days before the full moon. This increase continues until 3 days after the full moon has passed, before it falls again for 2 days before rising again. The period around a full moon seems to have a lot of fluctuations.
Tabulated results for VIX analysis:
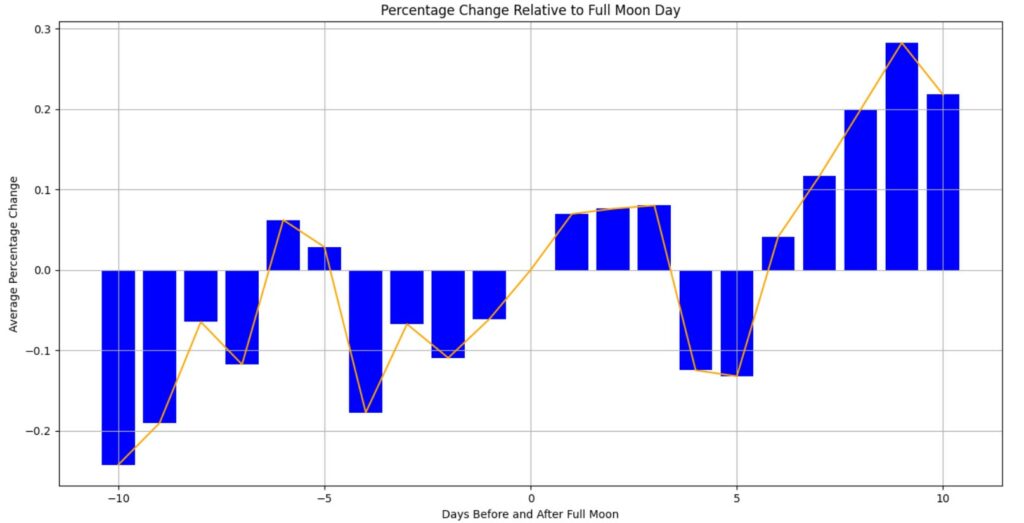
Graphed results for VIX analysis:
Volatility is a measure of how easily the market prices will change sharply. Traders typically associate increased volatility with increased risk and therefore lower prices. This is seen to be true as when the volatility is high, such as around 9 days before the full moon, 2-4 days before and 4-6 days after, this is when the SPX prices have their local minimums. Conversely, when the volatility is at its local minimum, such as 6 days before, 1-3 days after and 9-10 days after, this is when the SPX prices are at their local maximums.
For the new moon:
Tabulated results for SPX analysis:
Graphed results for SPX analysis:
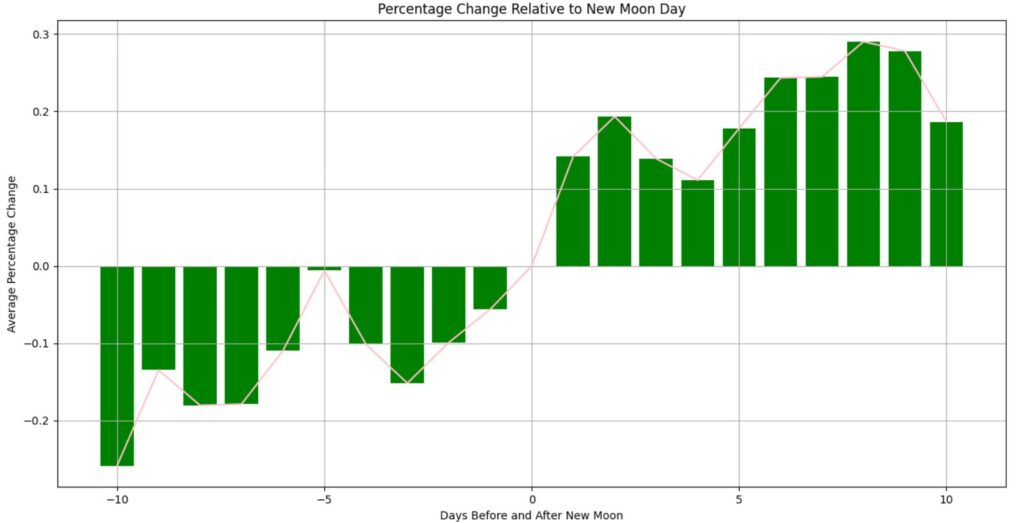
For the new moon, we can see that there are a lot less fluctuations. The general trend of the SPX prices seems to be increasing. The increase begins roughly 3 days before the new moon and continues until around the 8th day after the new moon before SPX prices begin to fall again.
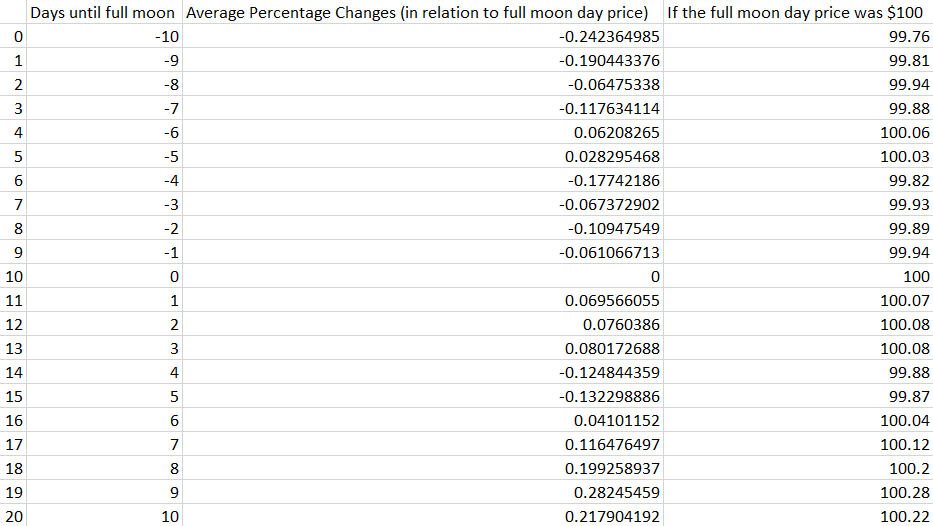
Tabulated results for VIX analysis:

Graphed results for VIX analysis:
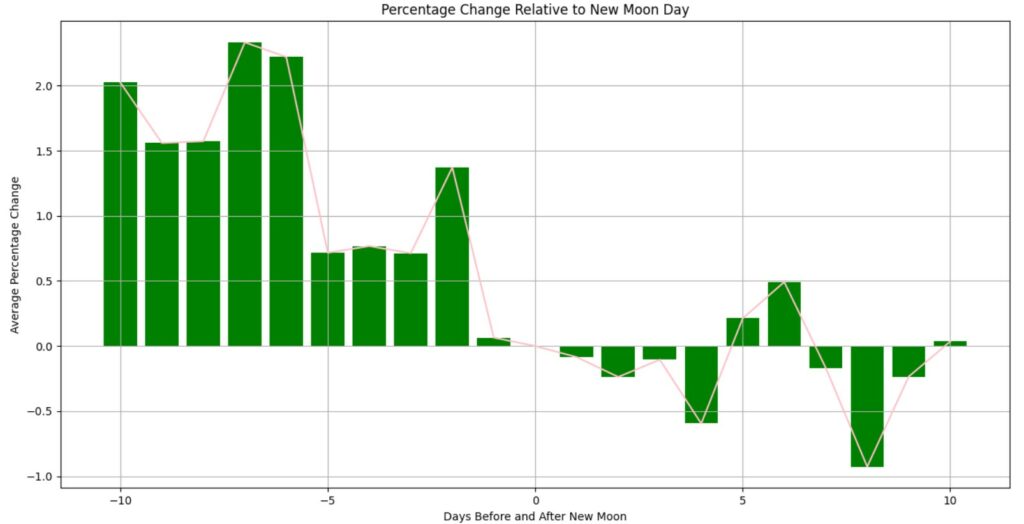
The increased volatility from 10 days before until 2 days before is reflected by the relatively lower SPX prices then. However, there is a sharp drop in volatility one day before the new moon. Interestingly, there is a sudden small rise in volatility 4 days after the new moon before it falls off again.
Conclusion
Moon phases have commonly been associated with human behaviour [3] (Owens et al., 2006). In particular, the full moon was widely believed to cause people to act crazier or more rash than usual and this is seen in the increased fluctuations surrounding the full moon. For the new moon however, it seems to improve the mood of traders as it generally decreases volatility.
References
[1] Cremers, Martijn, Antti Petajisto, and Eric Zitzewitz. Should benchmark indices have alpha? Revisiting performance evaluation. No. w18050. National Bureau of Economic Research, 2012.
[2] Zhang, Jin E., and Yingzi Zhu. “VIX futures.” Journal of Futures Markets: Futures, Options, and Other Derivative Products 26.6 (2006): 521-531.
[3] Owens, Mark, and Iain W. McGowan. “Madness and the moon: the lunar cycle and psychopathology.” German Journal of Psychiatry 9.1 (2006): 123-127.